Local knowledge for solving global problems
supporting precision farming, reducing costs, improving soil health and enabling soil carbon credits.
supporting precision farming, reducing costs, improving soil health and enabling soil carbon credits.
xSpectre's business model is developed using the NABC (Need, Approach, Benefit, Competition) framework, first put forward by the Stanford Research Institute (SRI). We participated in Linköping University Entrepreneurship and Development (LEAD) BootUp program during spring 2022. LEAD then used our innovation for a trainee program, Entrepreneurs in Residence, during the autumn of 2022.
Soil is formed over millennia and increasingly recognized as a vital resource. Soil management affects 16 of the 17 Sustainable Development Goals (SDGs) 2030. Soils are the hub for cleaning water and producing food, fodder, fibre and now also fuel for a growing world population. But soil health is declining world-wide. This affects both the soil productivity and generates green house gas (GHG) emissions. New methods and policies are required. For producing more food, fodder, fibre and fuel while also preserving, or improving, soil health. The methods for accomplishing this are known: zero (or low) tilling, cover (or dual) crops, agroforestry, use of legumes, adaptive grazing, residue management and exogenous carbon amendments, subsoiling and crop rotation.
Regenerative precision farmingWith the era of cheap fossil fuels nearing its end, escalating soil health decline and dwindling yield per resource input, the shift to new agricultural management methods is becoming increasingly urgent. Empirical results clearly demonstrate that regenerative precision farming starting from the methods listed above for supporting soil health, bring the same yield as classical mechanized high-input management, but at a much lower cost. And with the added benefit of sequestering atmospheric CO2 and improving soil heath. Farmers adopting regenerative precision farming thus make a larger economic profit while also improving their soils. The bottleneck, or need for acquiring regenerative precision farming is information (see the popular article Why soil measurement is a key challenge for carbon farming. What is needed is information on soil and plant health in (near) real time. Put differently: to minimise the input of machinery, fuel and chemicals, farmers must have control of the soil and plant status to restrict costly (and soil destructing) activities to a minimum. Thus can the farmer produce more grain for less pain.
The need for a solution that can provide (near) real time soil information already exists today. Escalating climate change and carbon emission/reduction pricing is, however, also driving an emerging market for direct soil carbon credits.
Soil carbon creditsHitherto soil degeneration has not been reflected in the economic market - soils have largely been de-facto regarded as externalities. Driven by urgent problems with climate warming and famine, the need to preserve, or even improve, soil health is increasingly recognized. Both by local farmers and by policy makers, as well as the stakeholders in the food chain in between. This has paved the way for a new market of soil health in general and soil carbon credits in particular, driven by 3 needs:
This new market for carbon credits based on soil organic carbon (SOC) requires a cost-effective and robust monitoring and modeling framework. Existing carbon credits for soil sequestration, mainly in North America and Australia, are plagued by regional variations and fears have been raised that the integrity of soil carbon credits is eroding (see the article Crediting agricultural soil carbon sequestration, by Oldfield et al, 2022 published in the journal Science). European countries have not embraced crediting agricultural soil carbon sequestration. Nevertheless, the development of new agricultural technologies promoting SOC formation has captured a large interest and field trials are in place, for instance, in Sweden (Svensk Kolinagring) and Finland (Baltic Sea Action Group).
The European Commission is strongly supporting development of a common European Soil Carbon Credit. That requires a standardized system of certificates, that the Commission envisions being based on a combination of rapid in-situ data collection and remote sensing.
Soil carbon and climateGreen house gas (GHG) emissions are jeopardizing the stability of Earth’s climate, threatening the sustainability of both existing ecosystems and subsequently human life as we know it. GHG emissions from soils, primarily driven by the metabolism of the soil organic carbon (SOC) stocks and generating carbon dioxide (CO2) contribute around 5 % of the global GHG emissions with an estimated gross efflux of ∼60 Gt C per year. It is estimated that the accumulated land cultivation has depleted the global soil carbon stock of 116 Pg of carbon.
But agricultural soils can also sequester carbon, with estimates or annual potentials ranging from 100 to 1000 kg C per hectare, depending on soil type and management practices. Reversing the flux of carbon across the soil-atmosphere interface and accumulating more SOC while sequestering GHG (carbon or regenerative farming) has major benefits, also for soil fertility and soil health. The recent (2022) IPCC assessment report also points out carbon farming as one of the major pathways for preventing the global temperature rise to exceed 2 centigrades compared to pre-industrial conditions (chapter 7 - Agriculture, Forestry and Other Land Uses).
Scientifically validated, cost-efficient and widely applicable, monitoring and modeling frameworks are required in order to identify the effect of different management options and how they affect soil carbon fluxes and stocks. The most promising approach for rapid assessment of soil health and carbon fluxes is soil spectroscopy.
We have created a solution to easily, quickly and cheaply analyze soils and their properties with a hand-held spectrometer directly in the field, at home in the kitchen or in the lab. The translation into soil properties takes place via a cross platform app that connects the spectral signal with a database and that uses both AI and a patent-pending mathematical-geometric model. The translation requires that the relationship between spectral signal and soil properties be defined in advance. In December 2021, the Open Soil Spectral Library, OSSL was launched, which in addition to spectra also contains wet chemical analysis results. With the OSSL global coverage as a basis, it is possible to create regional a-priori models. With the help of external sensors connected to xSpectre's spectrometers+, users can create/improve their own local models with higher accuracies.
Our solution can deliver information, for advanced users also translated into maps and vehicle/equipment control files via satellite and drone, at a precision and cost that does not exist today. It could also be a cornerstone in the transition to climate-smart agriculture and to verify soil carbon credits.
Value offerxSpectre's scalable solution is basically Software as a Service (SaaS) subscription combined with an initial hardware cost. The hardware cost includes one or more spectrometers and various external sensors (for example for humidity, salinity, pH and NPK). Annual subscriptions give access to the online resources, including storage space for spectral signals, regional and local spectral libraries and predefined global and regional translation models. The modeling, analysis and reporting that is supported as SaaS depends on the subscription level. As an outset, xSpectre's business concept identifies three customer segments:
While the initial hardware included with each segment varies, there is no limit for different subscribers to purchase additional spectrometers, external sensors or storage space for more spectral signals. The core difference between the customer segments lies in the offered SaaS that can only be upgraded by changing to precision or professional.
The basic segment would include only the spectrometer (with no +), a smaller number of annual spectra (maybe 500) and with analysis restricted to existing, a-priori defined, translation models. The precision level hardware offer also contains external sensors for field use and additives for spectral analysis also of liquids and gases (for example methane and carbon dioxide), and more storage and analysis capacity (maybe 2000 samples per annum). For the precision segment, interpolation from point measurements to map data is offered using ML, elevation data and humidity index from satellite radar images. The professional level would include 3 fully equipped spectrometers (and maybe 6000 spectra per annum), external Ion Selective Electrodes for lab-quality analysis of key soil constituents (pH, NO3-, NH4+, K+, Ca2+) and support for connecting models to drone and satellite images and thus map images of soil properties and generate control files for precision agriculture produced via ML and an expanded image and map base.
Value chain and partnersIn the short term, the value chain consists of:
In the longer term, additional services need to be developed:
We collaborate with an electronics expert regarding the design and development of microcontrollers and printed circuit boards (PCBs) and we have leased out the manufacturing of the PCB. We manufacture the hardware shells ourselves using 3D printing. Most external sensors are purchased as "plug-and-play" ready components, but some require manual soldering for adding the connection plug. The existing hardware production chain can be used for producing limited test-series of tens of spectrometers+. Stepping up production to hundreds would require leasing out the 3D printing of shells, the soldering of external probes plugs and the assembly. Turning to a full production chain (more than 1000 spectrometers) would require setting up an international production chain.
The mobile app as well as model and analysis tools are developed internally, with some consultant support. Databases and connection to mobile and further to the server side are developed internally; the development within cloud-based services and apps (e.g. Google Cloud Run) towards more efficient and flexible solutions requires external support. As the principal app and server side components are already defined and functional, the additional resource required for shifting to Google Cloud Run are, however, limited.
The in-house development and support of the app and backend cloud-based services can only support the adopter category "Innovators", willing to accept a lower user-friendliness and somewhat flawed services. To bring the Information and Communications Technology (ICT) solution to a level where it could be used in niche application ("early adopters"), including dedicated climate smart farmers/advisors or higher education, requires further, but still minor, improvements of the cross platform app and the server solution. To reach larger markets (crossing the chasm to early and late majorities) is in a different ballpark.
Minimum Viable Product (MVP)There is a mismatch between the simplest (minimum) product (spectrometer without external probes) and the initial customer segments of innovators that almost certainly belong to the precision customer segment. The adopter category innovators, and probably also a large fraction of the early adopters, are looking for a system that can be verified - that is a spectrometers+ with external probes for both field and laboratory. Our market research shows that the farmers and advisors that have tested, or are knowledgeable about, NIR technology for soil sensing, want more proof of accuracies.
Unique Selling Point (USP)To create our Unique Selling Point (USP) and reach the market can thus either be via extensive in-house tests of the accuracies and then launch a spectrometer without external probes (no +), or to launch a test-series of subsidized, or free, spectrometers+ for innovators that are willing to collect data and give feedback on the development of both the hardware and the software solutions.
The latter approach is more in line with our USP vision of establishing a user community of citizen scientists. It is also not per-se more expensive compared to in-house development. To approach the approximately 20 innovators that we have identified, of which half are composed of Swedish and other European carbon farming advisors and the other half European research organizations dealing with soil characterization, would cost approximately USD 25,000 in hardware (including external probes).
Revenue streamThe production cost per spectrometer is currently around USD 400, excluding any external probes. This cost can drop to half already at a volume in the hundreds, and even further with an international production chain and new generations of microcontrollers and sensors. The margin on sales should be possible to set at 100% at the two latter production volumes. Sales and marketing costs (Customer Acquisition Cost, CAC), however, would erode this margin over the first years.
Costs for subscriptions and services for existing solutions at any point in time and for each customer segment should also be possible to be set with margins of 100% - but we expect that the development costs over the first years will consume also these margins.
We thus believe that the revenue stream could start generate a profit when we reach a thousand users and can establish an international production chain. This will take 2 to 4 years dependent on the investments we can raise.
Challenges for reaching the majority marketThe biggest technical challenges for reaching the market are to develop the user-friendliness and verify the reliability and accuracy of NIR sensing technology. As outlined above, we have reduced costs and streamlined the hardware production by developing our own circuit boards but need to develop this further, partly to be able to replace the spectral sensor with newer, better and cheaper alternatives, partly to include a touch screen and internal data storage for improved user-friendliness. The estimated costs for technical development allowing us to reach out to hundreds of early adopters we estimate to be in the range of 150,000 to 200,000 USD. this includes freely distributing 20 to 30 spectrometer+ to innovators willing to contribute in the development of both the hardware and the software.
In order to offer product, the entire chain from measurement, data transfer, storage, analysis, information extraction and reporting as both graphics and text needs to work seamless; while all parts are operational and the system works smoothly "on a sunny day" the interconnection needs to be improved (also for rainy days). We estimate the cost for software and platform development for reaching early adopters to also be in the range of 150,000 to 200,000 USD.
The business side needs to be defined and priced in order to offer solutions customized for each category of clients. We estimate that developing offers and services for three customer segments would cost 150,000 to 200,000 USD. We further estimate the Customer Acquisition Cost (CAC) for the first hundred early adopters to be in the range 250 to 500 USD per user to then decline to perhaps 50 to 100 USD.
Reaching beyond the innovators and early adopters, and entering the majority markets, will demand stepping up the user-friendliness further, launching training modules and more comprehensive support, and then also adding solutions for allowing 3rd party model publication and add-on subscription for those. The cost for closing the chasm to the larger market sections we estimate to be at least double the costs for reaching the early adopters (that is at least 500,000 USD) - but with substantial lower costs for CAC.
The global Total Available Market (TAM) for precision farming is expected to grow from USD 8.5 billion in 2022 to USD 15.6 billion by 2030, at a Compound annual growth rate (CAGR) of 7.9%.
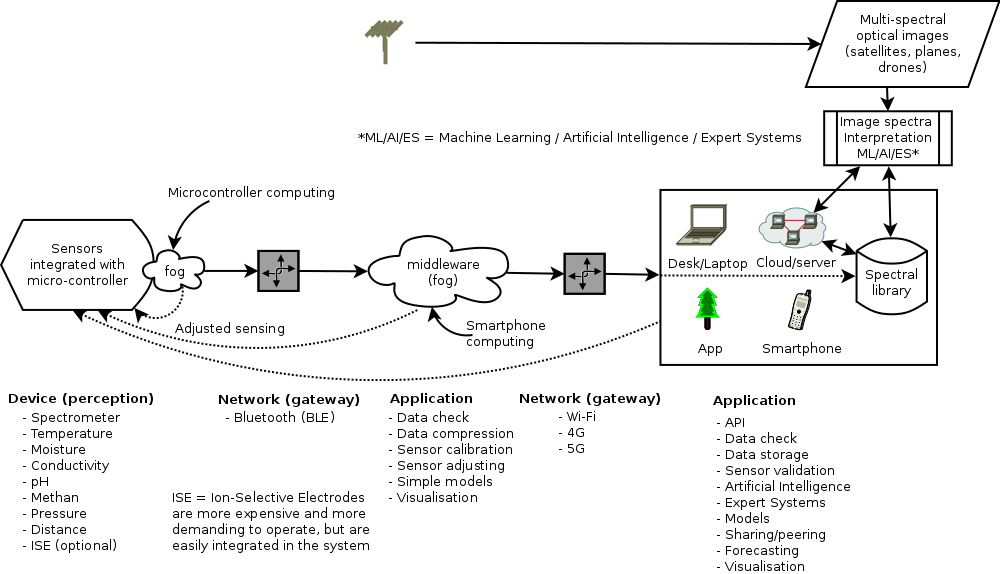
This market is driven both by technological and economical factors. The technological factors are linked to the general development summarised as Internet-of-Things (IoT), with developments in all parts of the chain formed by sensors, networks, applications, computer modeling power and actuators (Fig 1). The economic factors are primarily cost savings, in e.g. man-power, machinery, fossil fuel consumption and fertilizer use, rather than increases in yields. A growing economic factor is the development of soil carbon markets promoted by governments worldwide. Only a small portion of the global TAM regards sensors for soil conditions. Estimating the Serviceable Available Market (SAM), both thematically and geographically is near impossible. What is rather certain, however, is that the sensing sector is most likely growing faster than other parts of the smart farming chain (fig. 1).
Research and Markets estimates the global (TAM) market for soil fertility testing to grow from USD 4.3 billion in 2020 to USD 5.9 billion by 2028, at a CAGR of 4.1%. Persistence Market Research put the value of the present market to only 1.5 billion USD but with an expected CAGR of 6.1 %. The top players hold more than 60% of the market share. They include SGS SA, Eurofins Agri Testing, ALS Ltd., AgroLab, and Actlabs. The global region with the largest market growth is Asia-Pacific due to increased consumption of fertilizers in big arable land available.
Sweden has no legal requirements regarding soil fertility testing; the recommendation is a single test per hectare every 7th years. The Swedish market for soil fertility testing was thus approximately 15 million USD in 2020. Due to demands raised by the European Union the number of soil samples taken has more that doubled from 2020 to 2022. Whether this trend will continue or recede is uncertain. This means the SAM for soil fertility testing in Sweden could be estimated at 15 to 30 M USD per annum, but with a very uncertain growth rate.
The soil fertility testing referred to here is the classical wet laboratory (physical, chemical, and biological) testing to determine the growth potential of soil, indicating inadequacies of nutrients, potential toxicity caused by excessive fertility, and inhibitions due to non-essential trace minerals. It does not include testing required for a soil carbon market.
xSpectre's Swiss army knife soil testing concept brings benefits for the agricultural consultants that often do the soil testing (see section on Competition) - by allowing sampling a more dense grid of points at very low costs by using spectral modeling for extrapolating wet laboratory results. The relative low cost of xSpectre's spectrometers also opens for individual farmers to directly test soils in real time at negligible marginal costs. This is a novel and untested market, but the interest exists - given that the technology can be proven.
Soil carbon creditsThe market for soil carbon credits, primarily in North America and Australia is growing, but it is a disparate market that lacks accepted standards. xSpectre's pocket sized soil laboratory could become a tool for standardizing Monitoring, Reporting and Validation (MRV) of soil carbon credits. The size of the (future) soil sampling required for establishing an MRV of soil carbon credit markets is unknown. What is certain, however, is that new methods for rapid and cost-effective soil characterization in real-time, with proven accuracy, will lead to a more rapid growth of this market.
Soil Testing Equipment MarketA report released in April 2021 advertised by Report Linker estimates the present (2020) TAM value of the Global Soil Testing Equipment Market at $3.6 Billion, to reach $6.7 Billion by 2027.
Serviceable Obtainable MarketWe have put figures on the existing Total Available Markets (TAMs), but these figures lack the emerging market for MRV of soil carbon credits. We presume the later to be a, if not the most, important market for xSpectre's pocket sized soil sensor. Estimating either the Serviceable Available Market (SAM) for a geographical region and/or sector within the TAMs, or a Serviceable Obtainable Market (SOM) where xSpectre's handheld spectrometers+ could win market shares, is nearly impossible at this stage.
Competitors in the market of supplying soil information include:
Agricultural consultants, in Sweden for instance Hushållningssällskapet, Lovang Lantbrukskonsult AB (Linköping) and SOYL Sweden offer different advisory services to farms. One of the most prominent services is mapping of soil conditions. This essentially means that the consultant, or the farmer, takes soil samples that are sent for analysis to a wet laboratory. The consultants interpret the laboratory results and interpolates the point data to maps. The latter can be done with or without other covariates (e.g. topography or soil types) and with or without the support of remote sensing data from drones or satellites.
The consultants are both competitors and potential customers of xSpectre’s Swiss army knife for soil testing.
Wet laboratoriesThe analysis of soil conditions for farm management is today dominated by wet laboratories (even if NIR soil spectroscopy is part of the laboratory soil characterization). The frequency of soil laboratory testing in Sweden is approximately 1 sample per hectare every 7th year. In Sweden this is just a recommendation, other countries have leal requirements, not seldom at a higher resolution in time and space.
A future demand for higher frequency soil sampling can be met by more wet laboratory analysis. But this is a time-consuming and expensive alternative compared to complementing the wet laboratory analysis with spectral in-situ sampling. Thus it is unlikely that xSpectre’s soil spectrometer will outcompete wet laboratories, the relation would rather be a mutual benefit.
Wet laboratories in Sweden include Hushållningssällskapet Laboratorium, Eurofins and Agrilab.
DIY soil test kitsOne possible alternative solution for better surveillance of soil conditions is Do-It-Yourself soil test kits. These have, however, been around for a long time and should already have become a more widely used solution to be considered as a serious competitor.
Remote sensingUsing images from drones or satellites for soil mapping over larger areas (from fields to continents) is today commonly done. To map the soil conditions under green vegetation requires that the vegetation part of the spectral signal is removed (unmixed). Varying geometries between the sun, the land surface and the sensor causes further problems. Interpreting remotely sensed images is thus not trivial. Developments in both sensors and in computer modeling power (e.g. Artificial Intelligence) is leading to improved accuracies. If the interpretation is supported by local in-situ sample data, the accuracy of the interpreted remote imagery increase markedly.
Remote sensing is a serious competitor to xSpectre’s handheld in-situ soil spectrometer. In-situ versus remote sensing of soil conditions both have advantages and disadvantages. A combination that uses in-situ measurements for calibration of remotely sensed images holds promises for near real-time accurate soil properties mapping.
Companies specializing in offering processed satellite for farmers:
The European Space Agency keeps a list of Earth Observing (EO) satellite data service providers.
eDNASoil environmental DNA (eDNA) analysis has grown rapidly over the past decade. Reference databases that link soil conditions to eDNA exist for large regions in e.g. Europa and North America. Soil eDNA sampling and analysis, however, are tedious and expensive. The accuracies for estimating key soil physical and chemical conditions from eDNA are further unclear. Thus eDNA is not a competitor for spectral soil characterization at the present time. Future development might alter this.
Macrofauna characterizationMacrofauna (think: “earthworms”) characterization is a traditional methods for determining holistic soil health. Digital image processing and interpretation has led to methods for estimating the macrofauna using digital photography, rather than collecting and counting individuals. The sampling is, however, tedious and weather dependent, and the uncertainty of the results large. Macrofauna characterization is thus not an alternative to other methods for rapid soil surveillance.
Scientific field spectrometersScientific grade portable spectrometers for field use have been commercially available for decades. They are, however heavy and bulky, require a backpack and are usually operated by a PC that must be carried along. New developments have led to smaller units, but still requiring carrying cases or back packs. The prices are prohibiting for more widespread use. The difference in cost between using a scientific field spectrometer compared to taking samples for laboratory spectral analysis is small. xSpectres handheld spectrometer is a miniaturized science grade field spectrometer (and cost 1/100th of commercially available field spectrometers). But with a more restricted band width (350 - 1000 nm) compared to the larger scientific field spectrometers (350-2500 nm). New technologies for acquiring spectra in the 1000 - 2500 nm region is paving the way for cheaper sensors that fit into the design of xSpectre’s handheld device. Also the existing science grade field spectrometers will take advantage of this development.
Portable soil spectrometers and multi-sensorsOther companies and organizations developing portable (and sometimes handheld) soil spectrometers and multi-sensors:
Agrocares is a Dutch company specializing in on-site soil, crop and pest monitoring; they have a NIR scanner for soil and plant monitoring.
Grainsense offers a handheld NIR spectrometer for field tests of grain quality.
LaserAg does not offer field spectroscopy but are in the forefront using laser-induced breakdown spectroscopy (LIBS) technology for laboratory analysis of soil and vegetation tissue.
Myspectral offers a multi purpose rugged and handheld spectrometer - Lumini T with 64 bands @ 340~890 nm.
Our Sci offers the 10 band general purpose our sci reflectometer at USD 475. It is built using a dual broadband sensor and 10 different single wavelength LEDs ranging from 365 to 940 nm. The USD 475 kit includes a full suite of peripherals. At time of writing this in January 2023, Our Sci “are not currently accepting orders” on the reflectometer.
Stenon is a German startup that attracted crowd funding for developing a “digital spade” including a spectrometer and other sensors. The technical details and costs are only available in German.
Yardstick is developing a soil carbon sensing system using a spectrometer combined with a drill. They recently formed a consortium that raised 225 M USD for developing a system to “Measure soil carbon accurately, instantly, and affordably”.